Use case: a robust, distributed and scalable Nagios infrastructure
Today I want to share with you one of my recent1 implementation of a distributed, scalable and fault tolerant Nagios infrastructure: an open source solution (backed with commercial support if you need it) that is gaining even more traction in enterprise environments worldwide.
When working on a grand-scale server farm it became obvious that a single Nagios installation on a single machine can’t provide a good environment that supports a lot of hosts and services checks.
There are of course a lot of different solutions to this problem and the first is to create a master-slave (distributed monitoring) with multiple Nagios instances (I did such a solution for a former client with 5 geographically-distributed branches with a small number of checks without growth). This kind of solution is not the best if you want to scale fast and to a higher number of hosts/services and is also a little bit difficult to mantain the configuration (to ease this problem you have to do a little bit of scripting to keep everything in sync).
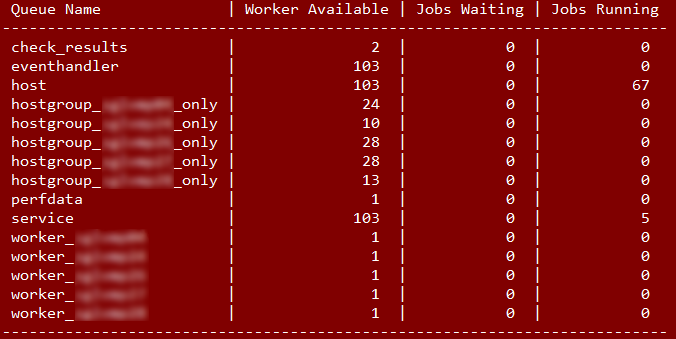
A running Gearman
To this day there are new technologies that can provide a more interesting solution, first of all the wonderful Gearman. To link Nagios and Gearman another great piece of software was used: mod_gearman. This broker puts every job (checks/handlers/performance data) into the appropriate queue on the Gearman server, ready to be processed by workers on an arbitrary number of remote hosts (not exclusively dedicated to monitoring if you want).
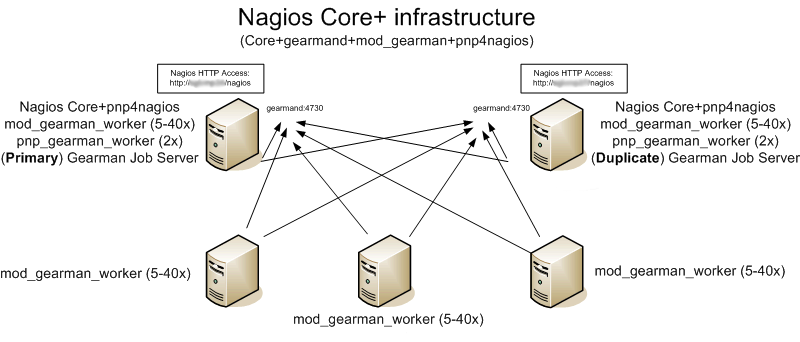
For our needs the basic Nagios Core was sufficient (since no one sees the web interface, more on this on a different post). We started with 4 Red Hat Enterprise 6.x virtual machines (given the customer’s specifications) with 4 cores each that are responsible of checks and event handler executions. Two of them are “special”: they run also a gearmand and a Nagios Core instances; one is the production one and the other is the standby one (which can be used as a second web console). The first mechanism that provides the fault tolerance is built on VMWare (vMotion/HA). In the (relatively unlikely) event of unavailability of the first Nagios Core the second one (which is in sync) can take over with a few manual steps (by choice not automatically). When we wanted to further increase the capacity of this infrastructure we cloned one of the worker machines adding the fifth worker machine in matter of minutes.
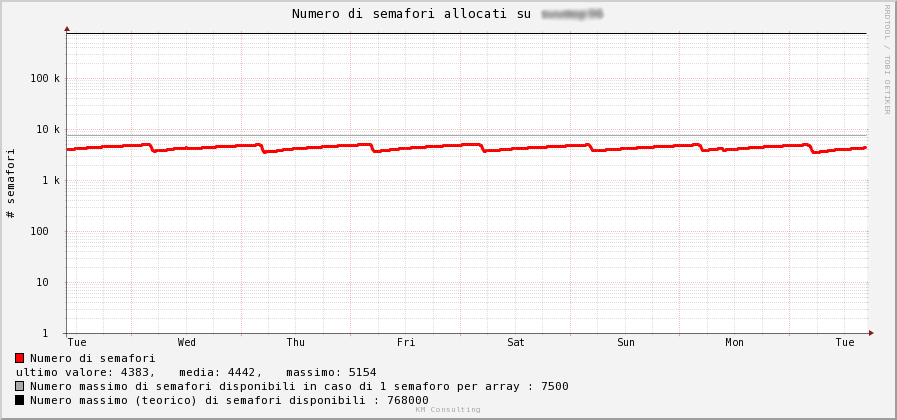
An example of a logarithmic graph
On top of that two parallel pnp4nagios installations deliver performance data to the RRD files on each Nagios Core server (this also avoids keeping in sync the huge perfdata directory). A few custom templates were developed to visualize data from different rrd files into a dynamically-generated graph. As a useful complement we added also the MK Livestatus broker to efficiently query Nagios from external scripts.
Each additional software (gearmand, mod_gearman NEB and workers, check commands) was compiled from scratch to allow the maximum flexibility in pairing fully functional versions.
This is the result which serves more than 1500 hosts and more than 11000 services (and counting).
What to know more? Contact us.
- well, it’s almost two years old and exposing a quite impressive uptime [↩]